August 25th, 2026
Econometrics and the OOH measurement debate

Steve Bernard
Head of Insight
Outcomes are not just one question. A client in one sector might prioritise brand salience, consideration and recommendation from their media investment, whilst in another sector, they are focused on driving shorter-term metrics, such as app downloads, share of search uplift or immediate sales from nearby stores. Long-term, short-term, hard metrics, soft metrics – the ‘R’ in ROI can mean many different things to different brands.
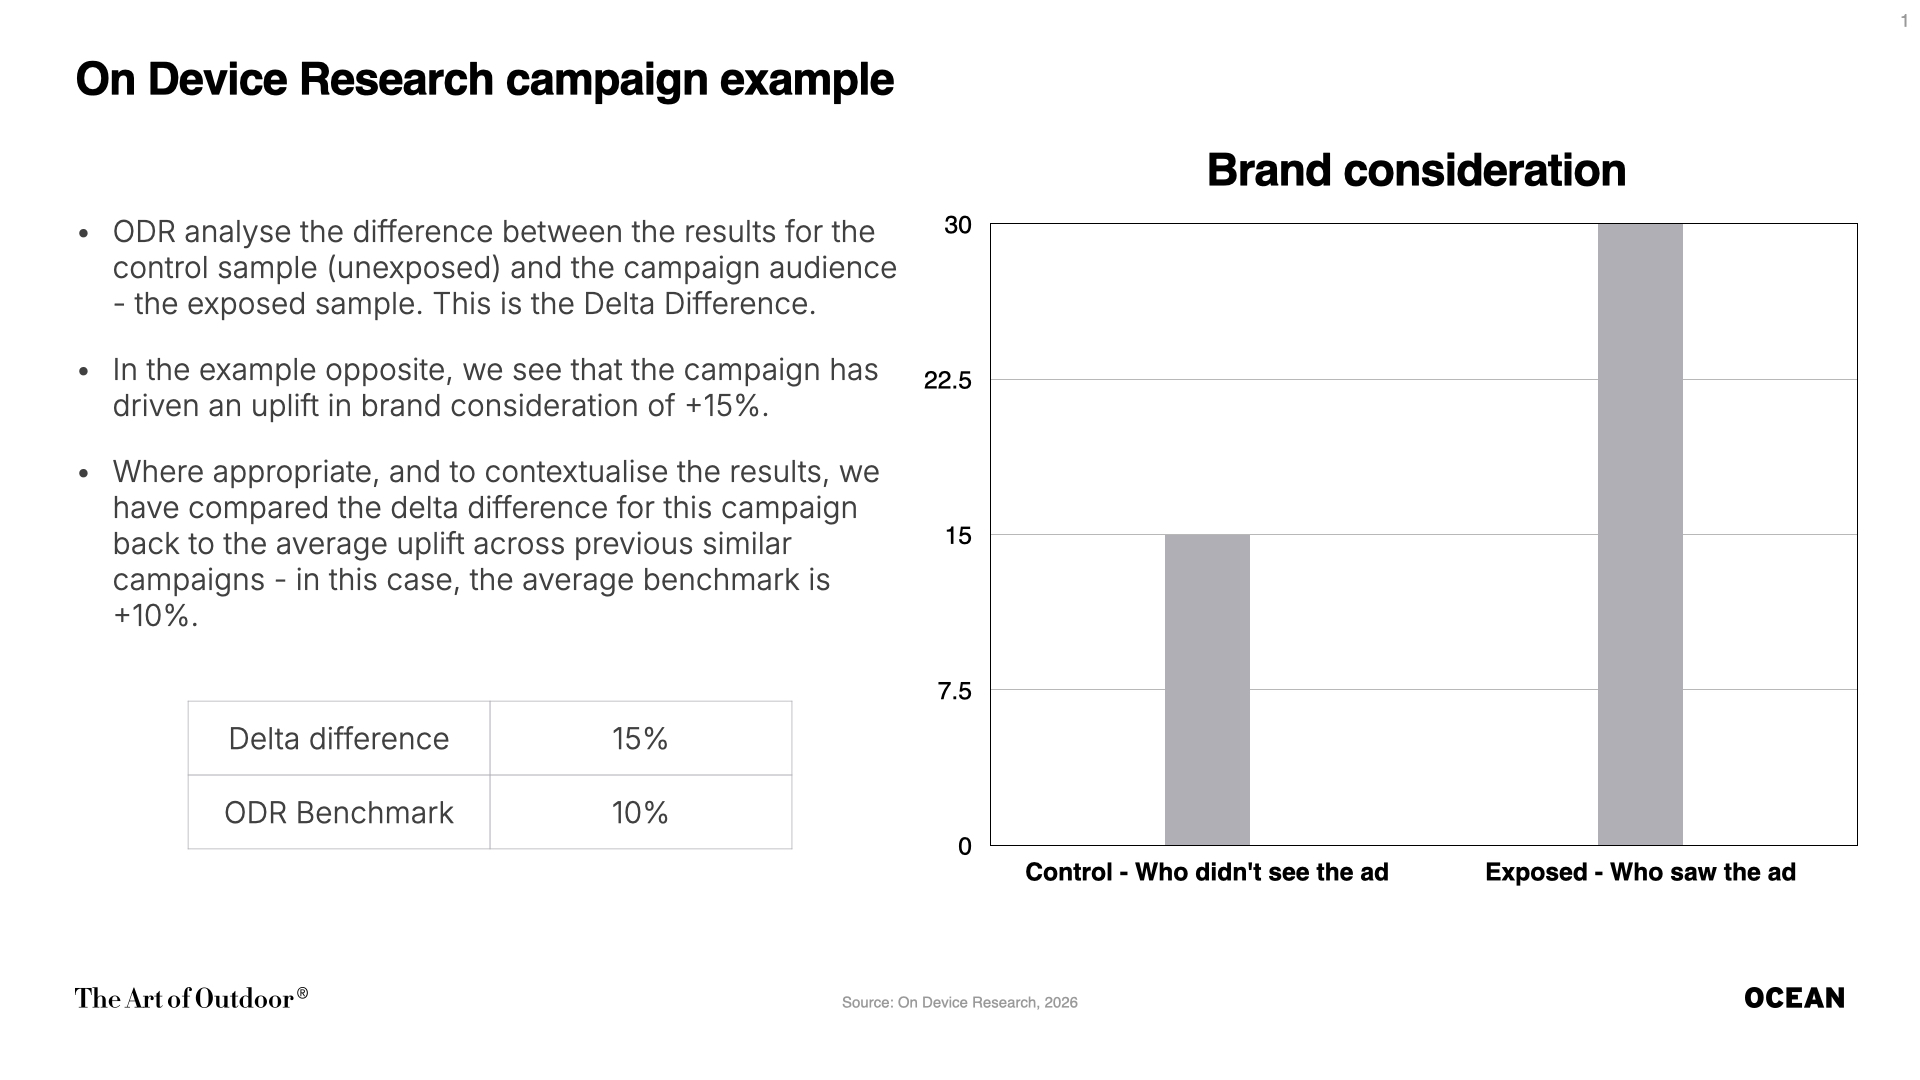
How this is measured can also vary significantly. Typically, in OOH (especially for premium sites), we measure the longer-term effect on the brand. We use survey-based studies which identify target groups who have been exposed to a campaign and measure their response to it, vs control groups of unexposed. The ‘delta difference’ shows the effect of the campaign on brand measures, such as spontaneous awareness, brand consideration or recommendation.
 Download
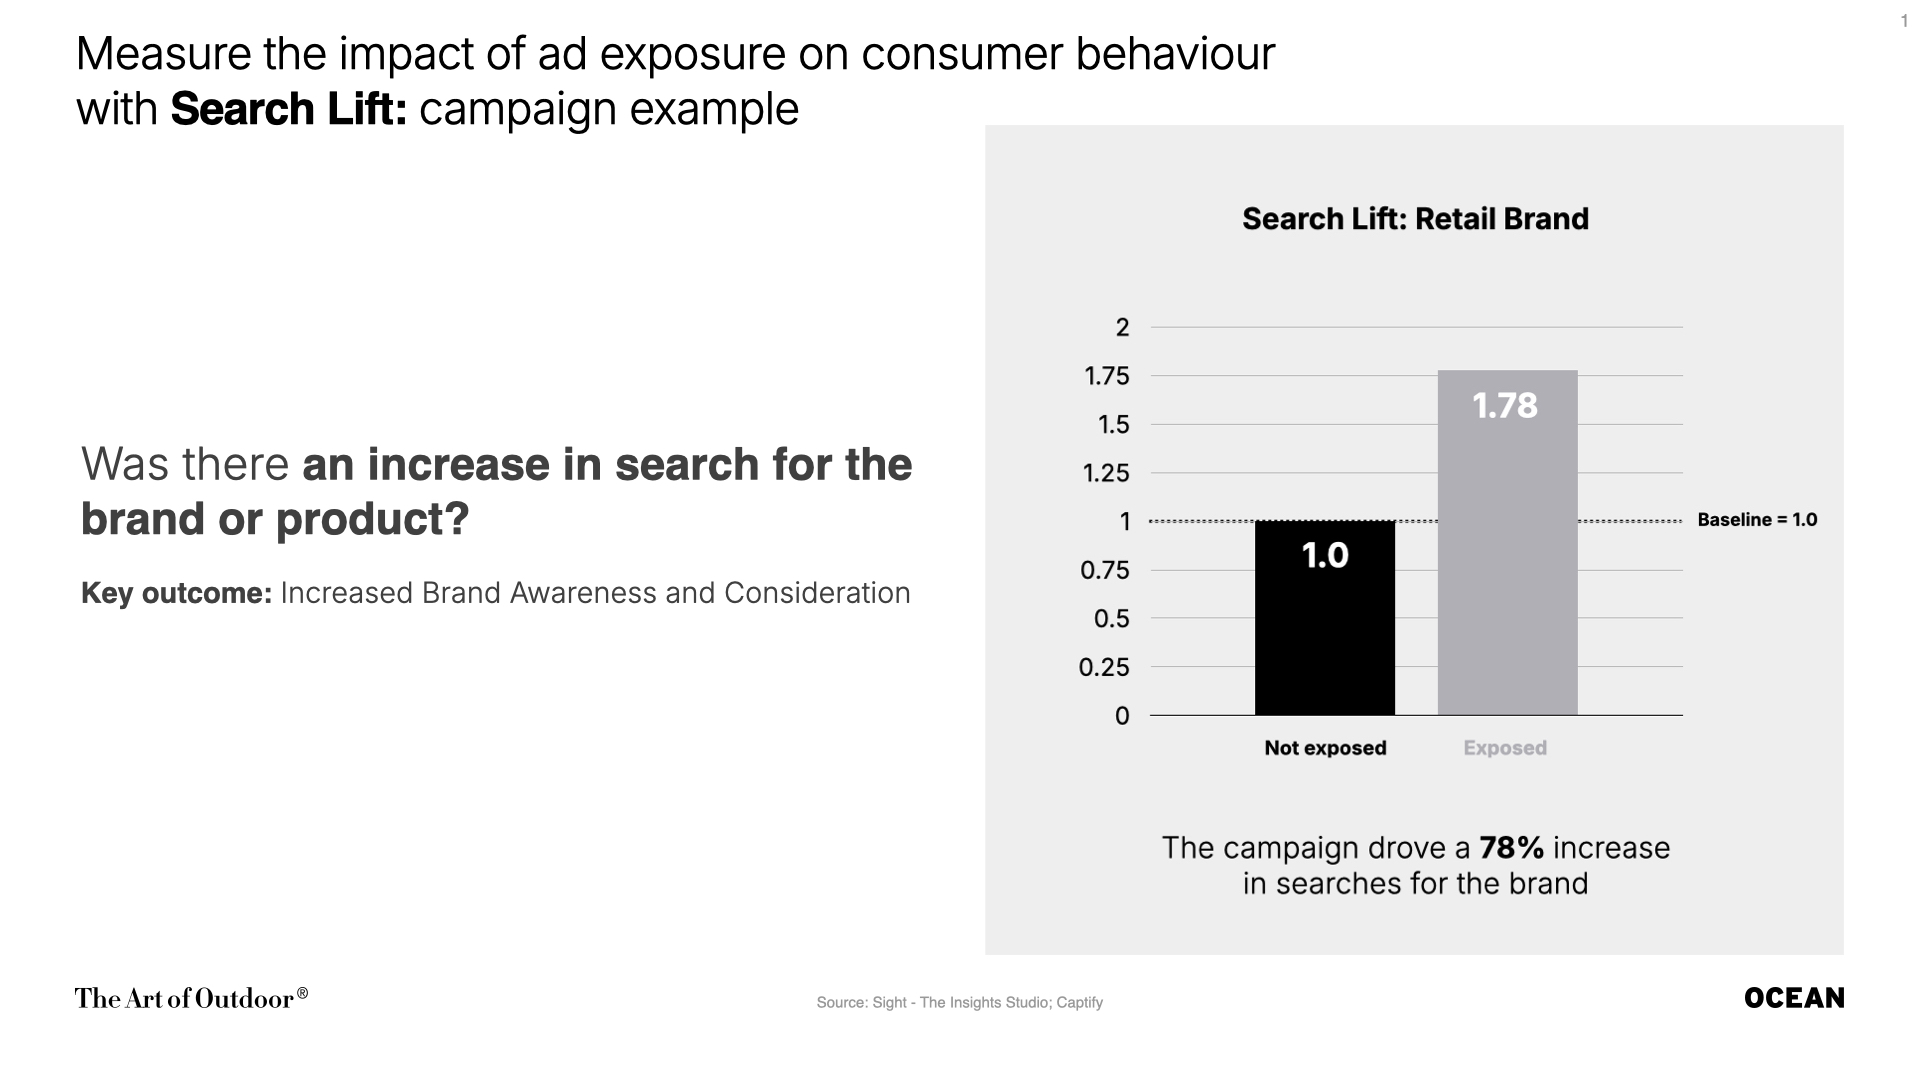
Going deeper, we can look at harder data metrics, such as search uplift (i.e the increased volume of search a brand generated from an OOH campaign in any given localised area), or whether a campaign had a meaningful effect on store visits, either during or immediately following the creative running in a retail environment.
 Download
There are also more sophisticated methods in development to better analyse the effect of OOH campaigns.
In simple terms; ‘MMM’ or Marketing Mix Modelling uses a regression-based attribution method. Regression is a statistical technique that finds the relationship between one thing you’re trying to explain (such as footfall or sales) and one or more things you think are driving it (such as ad spend). It’s a complex equation which answers a very simple question: if this input goes up by X, how much does the outcome change? In media, this is what modellers use to answer how much of a sales uplift came from on channel or another.
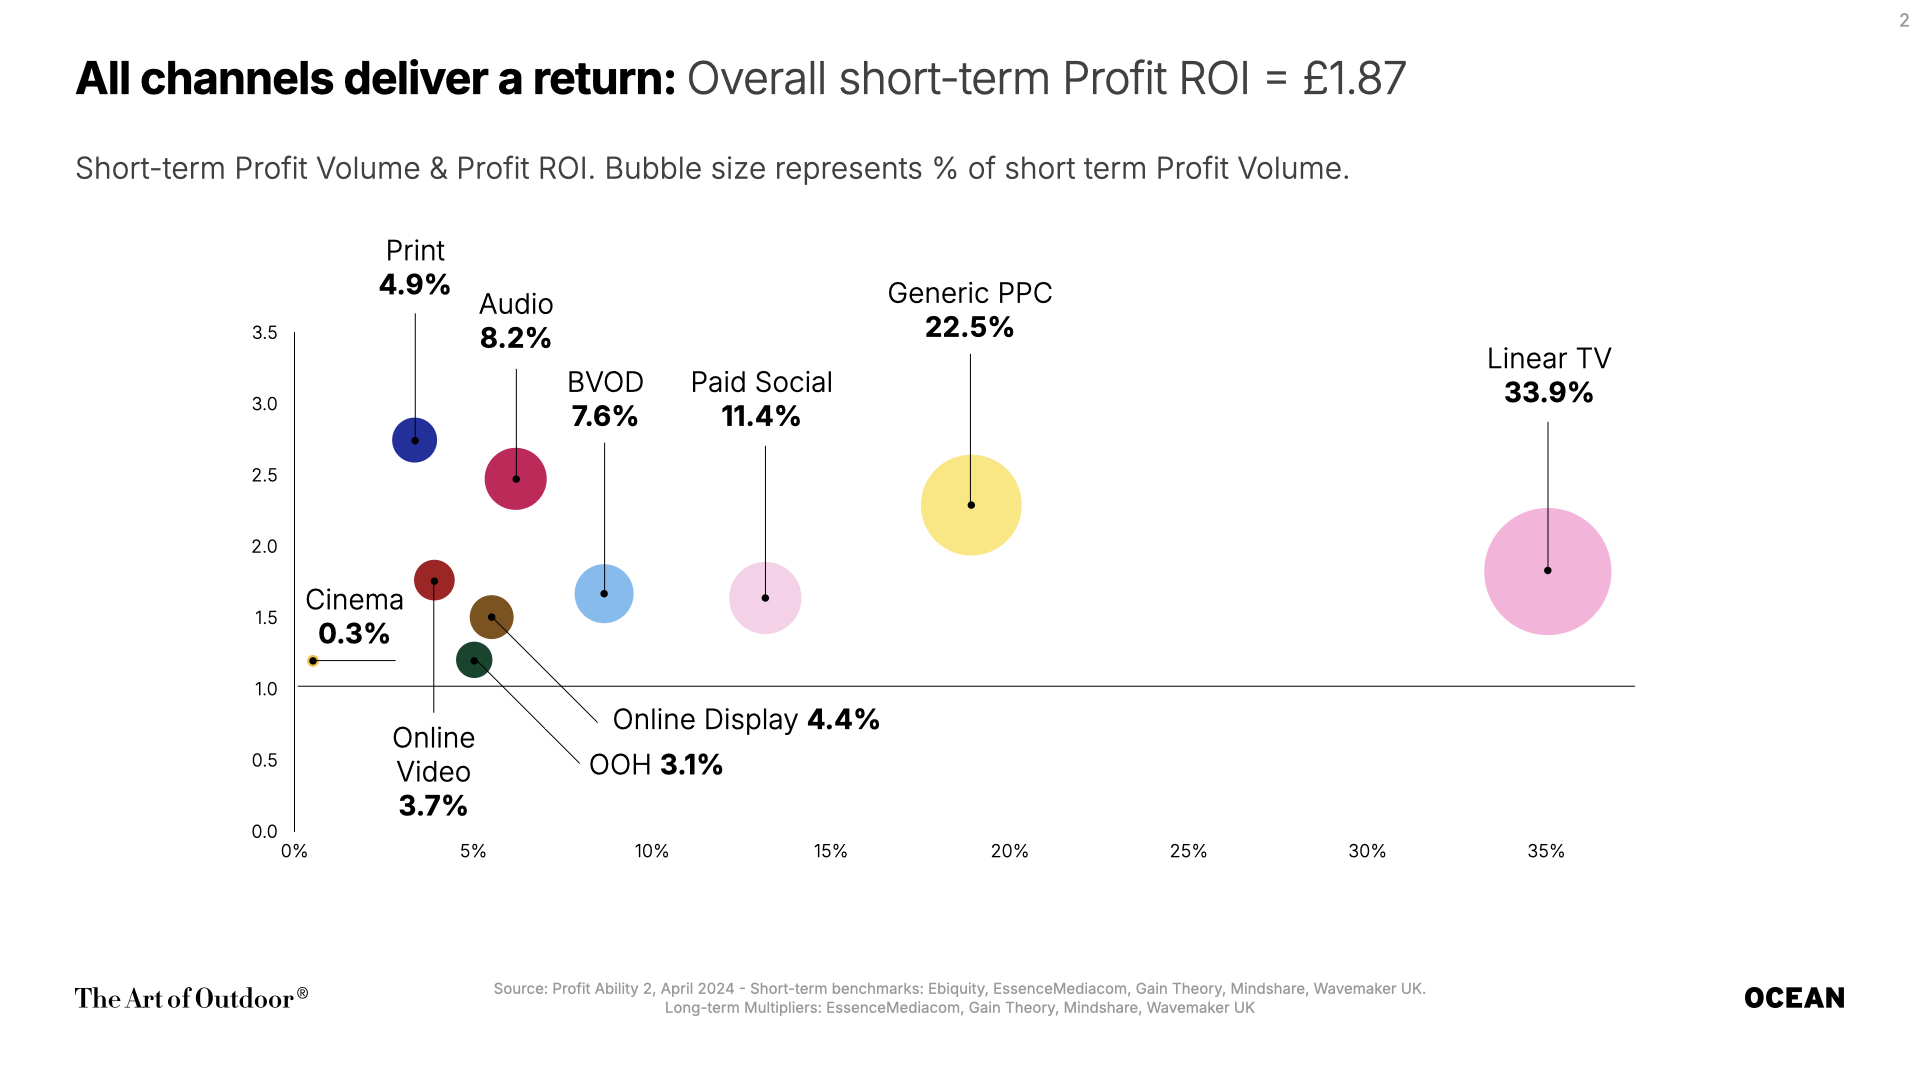
The conventional view is that OOH is not a strong performer within sophisticated MMM studies. A raft of industry research, most recently ‘Profitability 2’ revealed that whilst TV remains the broadcast choice for effective campaigns, OOH trails in driving the lowest volume of short-term payback (£1.19) and just £2.78 from a longer-term ROI perspective (ranging from two months to two years). This places the medium above Cinema and Online Display only.
 Download
However, OOH is a unique medium with varied formats, environments and frame types, and a clustering in urban centres. Econometric models tend have a ‘one-size fits all’ approach to how they measure different media channels. This simply doesn’t work for OOH, not to mention Ocean’s unique premium full motion portfolio and destinations.
Clustering is very specific to OOH. More than 75% of all UK roadside and shopping precinct screens exist in conurbations, with 53% in the top five conurbations alone. Using national models to measure the effectiveness of these screens is not going to reflect their true effect.
More generally, more than two in every three media modeller practitioners cite flawed data consistency as a significant barrier to gaining an accurate read of the OOH effect. This is often a combination of not enough clean, robust data on how many people saw an OOH advert, when did they see it and where.
The key solution for these challenges is in the data being granular, consistent, and robust.
Route
Fortunately, in OOH there is a gold standard joint-industry audience currency. Route tells us, with increasing granularity, who was exposed to a campaign when it ran. It does this through the bringing together of a 21,000-person sample (collected over three years), an extensive range of traffic and footfall sources, and the learnings from years of sophisticated visibility studies. The output is a visibility-adjusted contact – an impact. Impacts go far beyond ‘impressions’ – impacts are verified data points based on a realistic opportunity to see an advert playing on a screen. Whilst online impressions count who may have seen an ad, impacts count how many people actually saw an ad.
Route also uses its travel survey across a range of demographics, so we also know who actually saw an ad. Understanding this has become almost as important as measuring how many, combining the need for visibility and relevance.
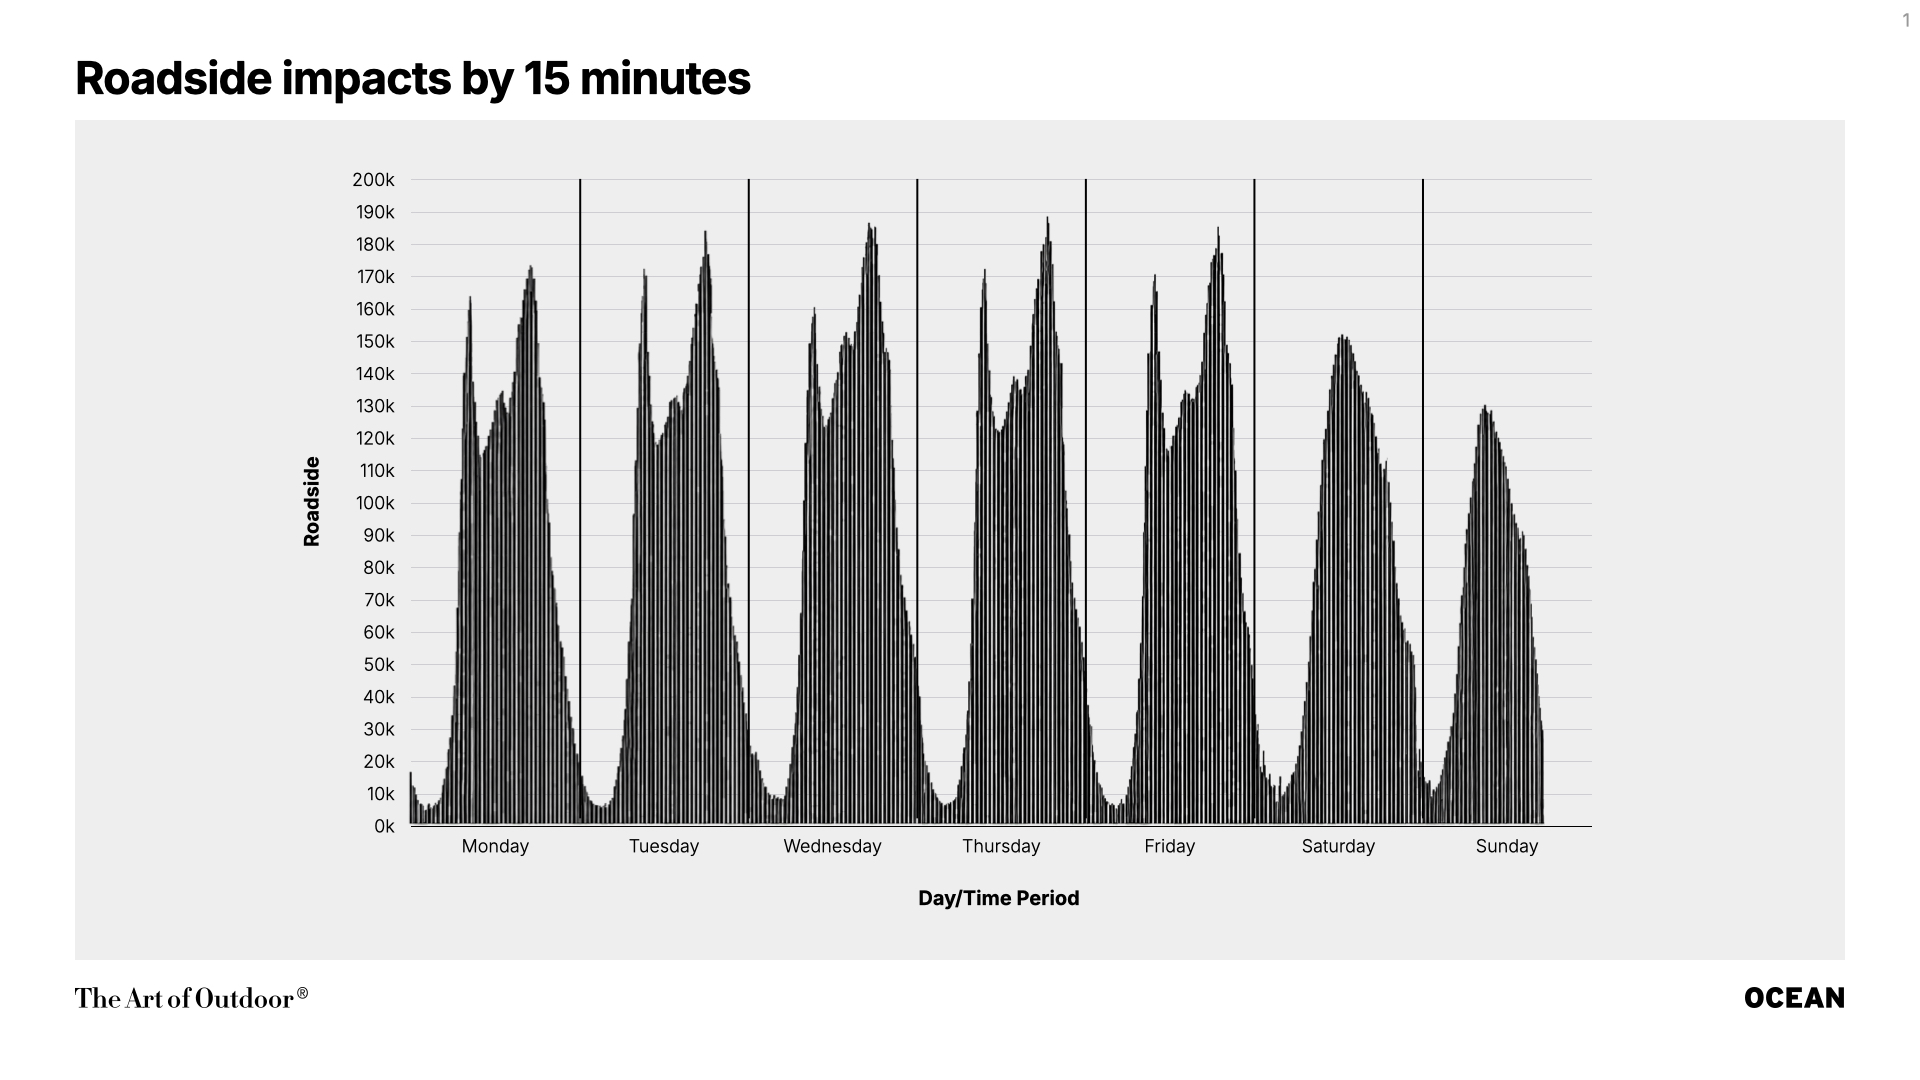
This data has also been getting more granular over recent years, with 15-minute reporting now possible, showing much greater variation in audience delivery throughout each day of the week.
 Download
Ultimately the quality of this data is high, and its thorough integration into econometric models is key to measuring OOH effectively.
Playout is an independent, industry-wide data warehouse that manages and enables the sharing of DOOH playout data. Verified and validated independently by MediaSense, Playout helps improve and promote industry accountability, providing standardisation to improve the communication of data and avoiding discrepancies. Clients using DOOH have at their disposal a report of precisely when and where an ad played out.
OOH and DOOH therefore have two powerful platforms to help solve econometric challenges: Route (who and how) and Playout (when and where).
Route and Playout have already started to enhance the quality of data available for econometricians, but much work is still required when considering how OOH can be accurately measured within MMM.
Some high-profile studies have been developed in recent years, drawing attention to the need for optimisations.
In summary: when econometric models match regional audience weights (using tools like Route) to local sales data, OOH transitions from a seemingly low-performing channel to a highly efficient driver.
In summary: correctly calibrated MMMs prove that high impact OOH environments work by fostering brand fame and emotional connection, without requiring an immediate, short-term digital click.
For more information on campaign effectiveness at Ocean Outdoor or to take part in a joint effectiveness study, please contact Steve Bernard, Head of Insight.

September 18, 2026
Share
Ocean Networks
The location is available as part of a network, please see below for details.
Please contact us on sales@oceanoutdoor.com to find out more.